
Noise Monitoring Sensors: What do they measure & how to ensure regulatory compliance

In the construction and infrastructure industry, managing the roar of heavy machinery, pile drivers, and excavation are often seen as checklists for just regulatory compliance. But in reality, it is about protecting the hearing of on-site workers, community relations and environmental noise pollution control. Noise & environmental consultants walking around with handheld devices at regular time intervals is a thing of the past. Instead, modern sites deploy automated noise monitoring sensors that continuously log, analyze, and stream cloud data in real time.
While noise monitoring for each construction site differs based on its location and local regulations, deployment and analysis at the core remain the same. Let’s dive deep into the basics of these aspects while also suggesting best practices.
Key Noise Monitoring Metrics Explained
To effectively monitor a site, you must understand the metrics regulatory bodies use to define legal compliance. Sound is measured in decibels (dB), but because the human ear perceives different frequencies uniquely, we use frequency weighting filters:
- A-Weighting (dB(A)): This filter mimics the human ear’s sensitivity, from low to high frequencies. It is the most used standard for environmental noise limits. On a regular construction site, these sounds would look like the steady engine hum of a bulldozer, the localized hum used to set wet concrete or tumbling sound of create mixer truck.
- C-Weighting (dB(C)): This filter includes much more low-frequency sound that travels large distances. It is typically used to monitor peak impact noises, like blasting, friction during industrial sawing, or pile driving.
- Z-Weighting (dB(Z)): This stands for zero weighting, meaning no frequency weighting filter is applied, and the measured sound is raw and unaltered.
The 3 dB Rule: Because decibels are logarithmic, every increase of 3 decibels doubles the actual acoustic energy of a sound wave. For example, a sound at 88 (dB(A)) has twice the physical sound energy of an 85 (dB(A)) sound, cutting the safe human exposure time in exactly half (from 8 hours down to 4 hours).
What statistical parameters are associated with noise monitoring?

When reviewing automated data logs, you will regularly encounter these statistical parameters:
- LAeq, T (Equivalent Continuous Sound Level): The most essential noise monitoring metric. It stands for the “average” sound energy over a specific time period (T), smoothing out spikes and drops into a single energy-equivalent decibel value.
- Lmax and Lmin: The absolute highest (max) and lowest (min) sound levels recorded during the measurement period.
- L10 (The Peak Indicator): The sound level exceeded for 10% of the monitoring period. It is the relatively louder events on site and is frequently used to evaluate traffic or intermittent construction activity.
- L90 (The Background Level): The sound level exceeded for 90% of the period. This is the ambient background noise when active construction stops.
- LCpeak: The absolute maximum peak sound pressure level using C-weighting, critical for monitoring sudden concussive sounds.
- LZ : Measurement of the unfiltered Z-weighting sound level
- 1/3 octave band: A standard octave band is where the upper frequency is exactly double the lower frequency. Multiple octave bands put together make a spectrum. A 1/3 octave band further divides an octave into three smaller bands for finer precision.
Even with these terms known, you need to understand which measurement to use in each context. LAeq is your everyday noise metric measured continuously to ensure that the overall sound of the site is not passing the thresholds. If your log shows an Lmax of 95 dB(A) but an LAeq of just 60 dB(A), you instantly know the site was mostly quiet, punctuated by a single, isolated loud event (like a truck horn or a single hammer blow). If your site is in an urban setting, the ambient sound could contribute to your site’s noise, unless L90 is measured and separated from the L10 peak noise that happens on your construction site. But if that Lmax surpasses 10% of your construction time, a.k.a. L10, you would need to justify whether that noise originated from your site’s operations or was it coming from the ambient sound, like traffic.
Beyond Decibels: Data Enhancements That Prove the Source
A common frustration for construction managers occurs when a noise limit is exceeded, with a looming threat of a fine, but the actual culprit was off-site. It could be a passing emergency siren, a neighbor’s lawnmower, or a low-flying aircraft. Decibel levels alone cannot prove this context. To fix this, modern automated noise monitoring systems integrate advanced secondary sensors:
- Audio Recording Triggers: When noise exceeds a pre-set threshold (e.g., 75 dB(A) for over 5 seconds), the sensor captures a high-quality, uncompressed audio clip. This can allow consultants to retroactively listen and confirm exactly what caused the alert.
- Automated Pictures & Video: Integrating a site camera or time-lapse system directly into the telemetry unit gives visual proof of site conditions at the precise millisecond an exceedance occurred. Often, acoustic cameras take continuous pictures of the site, as well as when the alert is triggered.
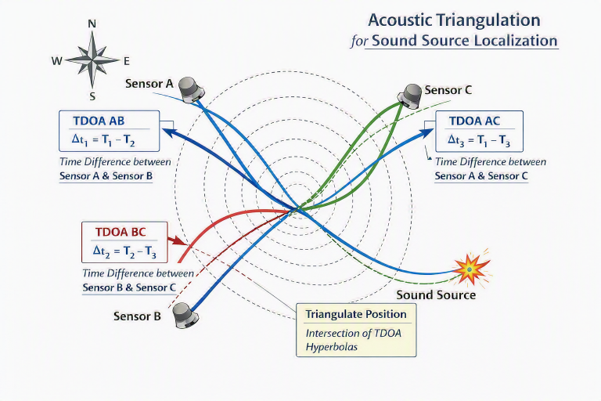
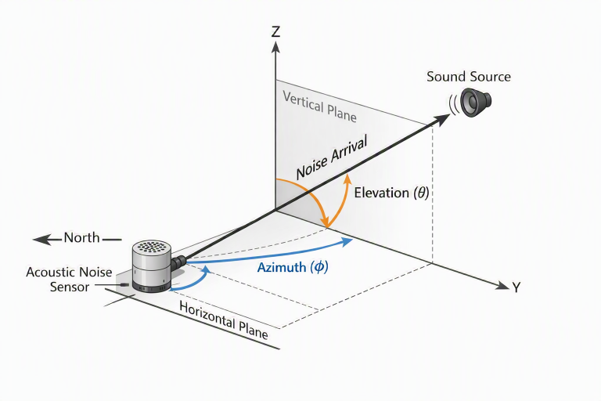
- Acoustic Directionality (Sound Source Localization): To understand the direction of the nuisance source, one can use the process of acoustic triangulation by calculating the azimuth (the horizontal angle) and elevation (the vertical angle). Advanced multidirectional microphone arrays (often set in a tetrahedral position facing different directions) measure the tiny phase or time lag of a sound wave hitting different sides of the sensor. The same sound wave hitting each individual microphone is then processed together to identify the exact position of the noise source. Furthermore, by processing this information over an image or a map, one can obtain an explicit visual overlay of the source on an image.
What are the regulatory norms used by local authorities for noise monitoring?
Regulatory authorities worldwide handle construction noise with varying degrees of severity. Depending on the accuracy and performance of the sound level meter (SLM), it is classified into different classes defined by the international standards like IEC 61672-1:
- Class 1: Designed for precision noise monitoring with narrower tolerances (±1.1 dB) and wider frequency ranges.
- Class 2: Made to be used for a general purpose, since they have wider tolerances (±1.4 dB) and limited frequency range.
| Performance Parameter | Class 1 (Precision SLM) | Class 2 (General SLM) |
|---|---|---|
|
Tolerance at 1 kHz |
±1.1 dB |
±1.4 dB |
|
Typical Frequency Range |
3 Hz – 20 kHz (extends to 20 kHz in many designs) |
20 Hz – 8 kHz (beyond 8 kHz performance not assured) |
|
Frequency weighting |
A, C, Z (higher accuracy) |
A, C, Z (lower accuracy) |
|
Directional Response Error (1 kHz tone) |
±1.4 dB |
±2.4 dB |
|
Longevity & Environmental Range |
-10 °C to +50 °C operation; robust mic, low self-noise |
0 °C to +40 °C operation; simpler mic, higher self-noise |
|
Dynamic Range |
Larger (~60 dB span; lower noise floor ~20 dBA) |
~50 dB span; higher noise floor (~28 dBA) |
Because of their use of high-grade microphones, lower internal noise and larger operating range, Class 1 SLMs or noise sensors are often the standard for environmental noise monitoring on a construction site. In contrast, Class 2 sound level meters may use cost-effective components and may also encounter internal noise.
For example, in the EU, the Environmental Noise Directive explicitly says using Class 1 instrumentation for environmental monitoring. It includes critical contexts like construction and industrial sites. This regulation is put in place to minimize uncertainty in the site’s regulatory compliance. On the other hand, usage contexts for Class 2 meters could be workplace noise measurement, community complaints investigations, or even preliminary screenings.
It is important to note that regardless of their precision standards, calibration of the instrument is equally important to eventually produce legally defensible data for high confidence noise monitoring.
While many automated noise monitoring systems are available on the market, they do not all offer the same level of measurement accuracy, regulatory compliance, data accessibility, or analytical capabilities. Before selecting a solution for your construction project, consider the following evaluation criteria:
- Measurement parameters: Does the system measure the acoustic indicators required by your project, including LAeq, Lmax, L10, L90, LCpeak, and octave-band analysis
- Class 1 compliance: Does the SLM comply with the regulatory requirement of the local authority, such as IEC 61672 Class 1? This is because some authorities explicitly require it.
- Weather resistance and battery reliability: Is your construction site going to be subjected to weather changes? If yes, can the noise sensor operate under rain, dust, heat, cold, and varying humidity levels without compromising measurement accuracy? Does it have appropriate ingress protection (IP) ratings?
- Cloud connectivity: Can the data collected be stored on cloud for easy and instant remote access? Can stakeholders access historical and real-time data remotely through dashboards, alerts, and automated reports?
- Audio recordings and source identification: Does the system provide audio recordings, acoustic imaging, sound classification, or source localization (for example using acoustic triangulation)? These capabilities will help distinguish construction noise from external sources such as traffic, aircraft, or nearby activities?
- Alerting & Thresholds: Can you pre-define multiple thresholds to ensure proactive measures can be taken before actual exceedances occur?
- Camera integration: Can the sensor take images for contextual evidence of site activities?
- Calibration processes: Does it provide documented calibration process to ensure data remains legally and technically defensible?
- Power autonomy: Is the system compatible with solar power or long-life batteries to minimize maintenance requirements and site visits? Is the battery robust under varying environmental conditions?
- Multi-Parameter Monitoring: Can the platform integrate noise data with dust, vibration, weather, or other environmental measurements for a complete view of site impacts?
A lot of the commercially available environmental noise monitoring systems from UBY, Svantek, Sigicom, Casella, etc. are compatible with these evaluations at varying levels. So, when comparing systems and solutions, you should focus primarily on regulatory compliance, measurement accuracy, environmental durability, data accessibility, and reporting capabilities.
Our UBY Structure case studies
- UBY Structure, uMonitor
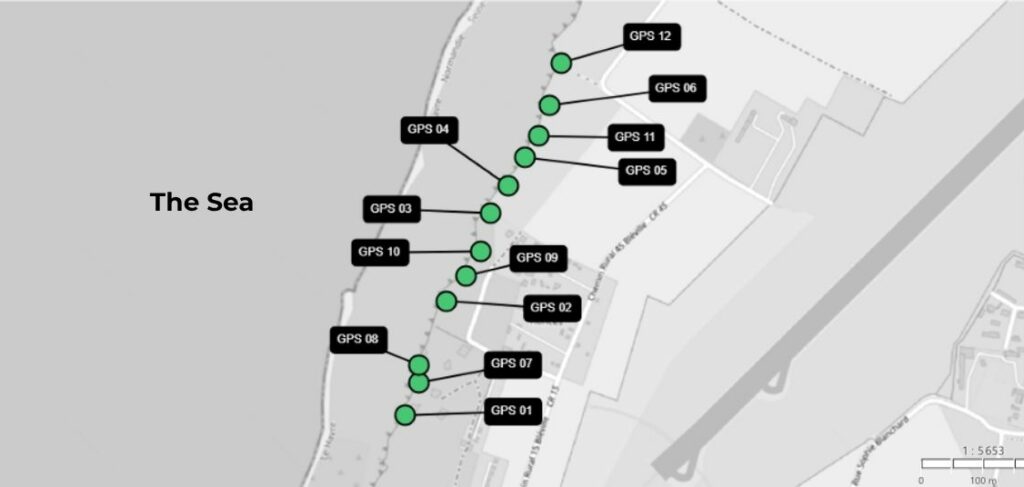
Coastal Cliff Monitoring with GNSS: Improving Long-Term Risk Assessment
- UBY Structure, uMonitor
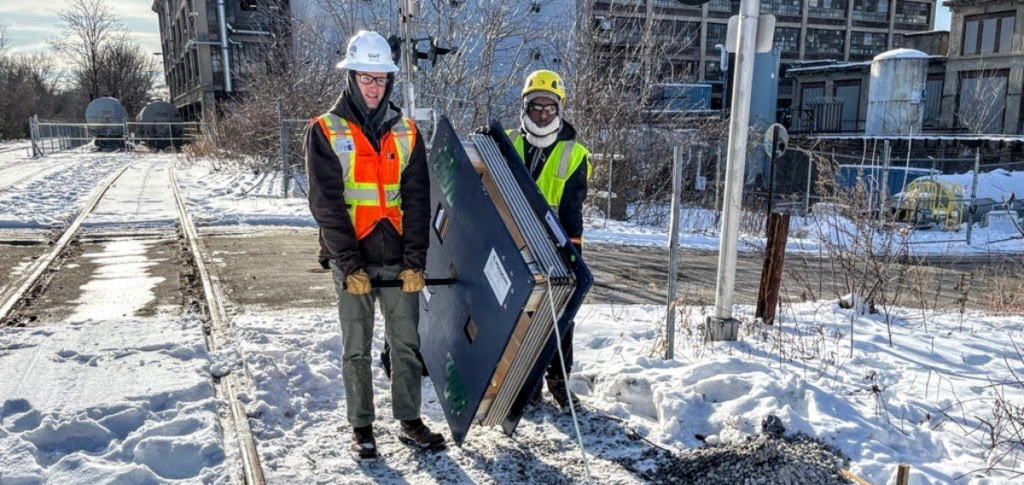
ShapeArray™ (SAA) for Railroad Track Monitoring: A Case Study
- UBY Structure, uMonitor
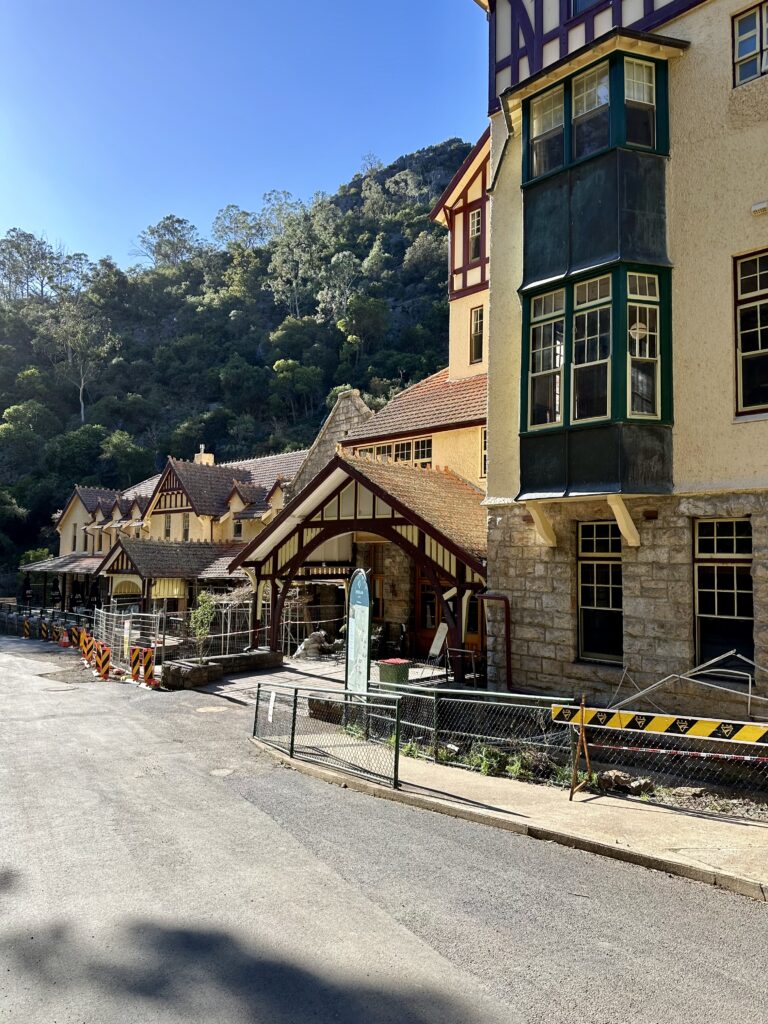
McIlwain: Vibration Monitoring at Jenolan Caves Heritage Hotel
- UBY Structure
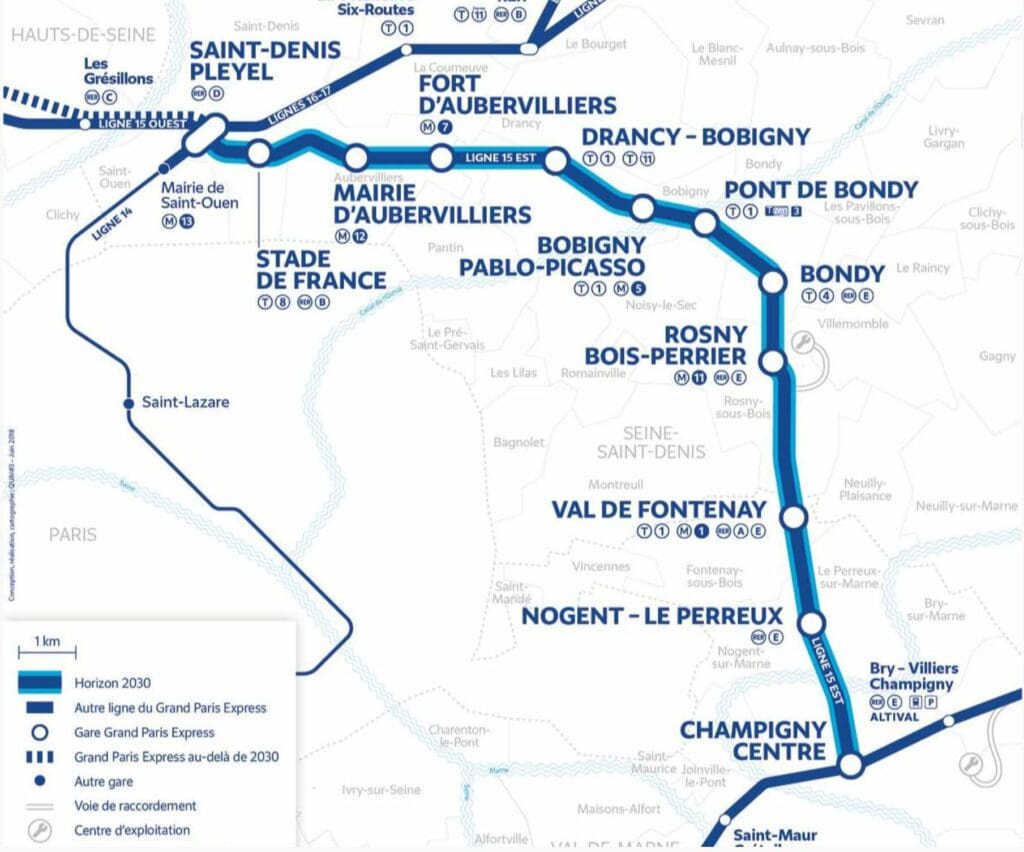
Tunnel Monitoring for Grand Paris Express – Line 15 – Northeast 2

- UBY Structure
Fécamp Offshore Wind Farm

- UBY Structure